An Illustrated Introduction to Linear Algebra
Chapter 1: Row vs column picture
This post assumes you know algebra, but no linear algebra. Lets dive in.
There are two big ideas I want to introduce in the first chapter: Gaussian elimination, (which is not strictly a linear algebra thing, and has been around for years before linear algebra came along), and row picture versus column picture, which is a linear algebra thing.
Money example
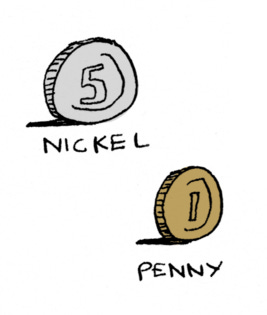
Let’s say you have a bunch of nickels and pennies, and you want to know how many of each do you need to have 23 cents.
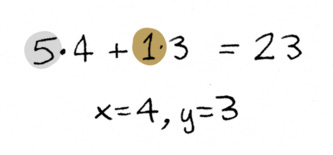
You could write that as an equation that looks like this:
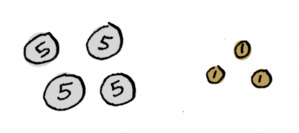
x is the number of nickels you need, y is the number of pennies you need. And you need to figure out the x and y values that would make the left-hand side work out to 23. And this one is pretty easy, you can just work it out yourself. You’d need four nickels and three pennies.
So x is four, y is three.
This kind of equation is called a linear equation. And that’s because when you plot this equation, everything is flat and smooth. There are no curves or holes. There isn’t a ^2 in the equation for example to make it curved. Linear equations are great because they’re much easier to work with than curved equations.
Aside: Another solution for the above is 23 pennies. Or -4 nickels + 43 pennies.
The point is you have two variables (x and y for nickels and pennies), and you are trying to combine them in different ways to hit one number. The trouble starts when you have two variables, and you need to combine them in different ways to hit two different numbers. That’s when Gaussian elimination comes in. In what world would you have to hit two different numbers? Does that seem outlandish? It’s actually very common! Read on for an example.
Food example
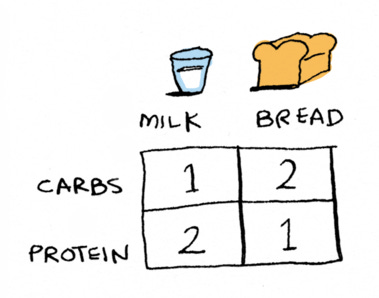
Now let’s look at a different example. In the last one we were trying to make 23 cents with nickels and pennies. Here we have two foods. One is milk, the other is bread. They both have some macros in terms of carbs and protein:
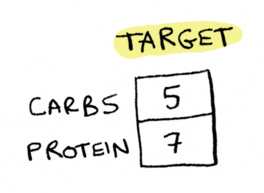
and now we want to figure out how many of each we need to eat to hit this target of 5 carbs and 7 protein.
This is a very similar question to the one we just asked with nickels and pennies, except instead of one equation, we have two equations:
Again we have an x and a y. Lets find their values. To solve these kinds of questions, we usually use Gaussian elimination. If you’ve never used Gaussian elimination, strap in.
Gaussian elimination
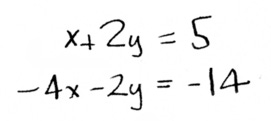
Step one is to rewrite this as a set of two equations:
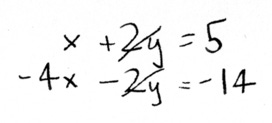
Now you subtract multiples of one equation from another to try to narrow down the value of one variable. Lets double that second equation:
See how we have a +2y and a -2y now? Now we can add the two equations together to eliminate y:
We’re left with one equation and one variable. We can solve for x:
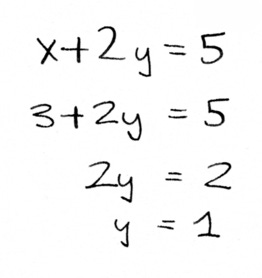
Aha, we know x = 3. Now we can plug that into one of the equations to find y.
We plug that in to one of the equations and find out that y equals 1, and there we have answer: three milks, one bread, is what we need.
This method is called Gaussian elimination, even though it was not discovered by Gauss. If you haven’t seen Gaussian elimination, congratulations, you learned a big idea! Gaussian elimination is something we will talk about more. It’s part of what makes linear algebra useful.
We can also find the solution by drawing pictures. Let’s see how that works.
Picture version
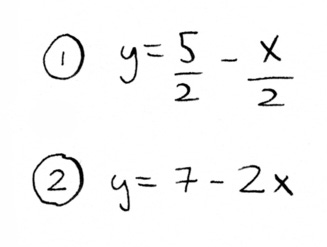
Let’s plot one of these lines. First, we need to rewrite the equations in terms of x.
Reminder: first equation is for carbs, second for protein. x is number of milks, y is number of breads.
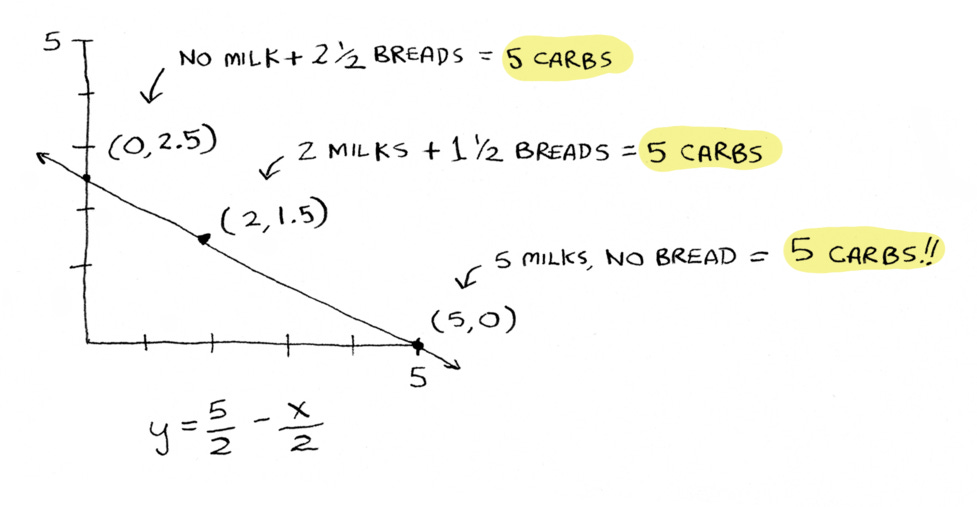
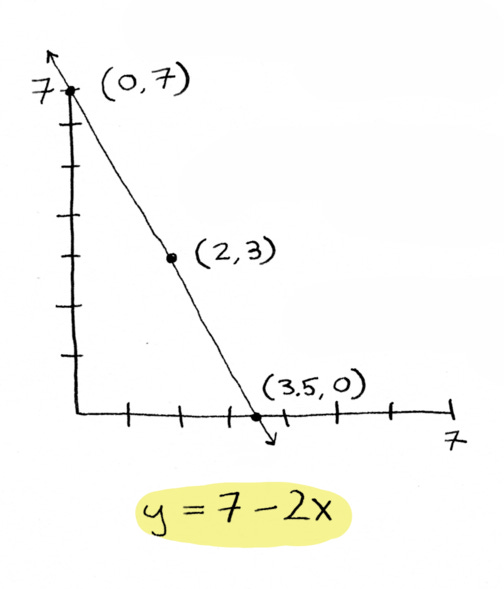
Now let’s plot the graph for the first equation.
Now, what does this line represent?
It’s all the combinations of bread and milk that you can have to get exactly five carbs:
So you can eat no milk and two-and-a-half breads, or two milks and one-and-a-half breads, or five milks and no bread, to get to exactly five carbs. All of those combinations would mean you have eaten exactly five carbs. You can pick any point that sits on this line to get to your goal of eating five carbs.
Note: You can see the line goes into the negative as well. Technically, 5 breads and -5 milks will give you 5 carbs as well, but you can’t drink negative milks. For these examples, let’s assume only positive numbers for the variables.
Now, let’s plot the other one. This is the same thing, but for protein.
If you eat any of these combinations, you’ll have met the protein goal:
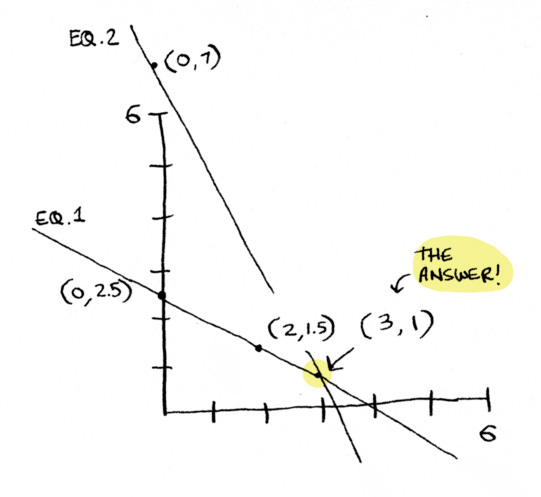
You can pick a point that sits on the first line to meet the carb goal. You can pick a point that sits on the second line to meet the protein goal. But you need a point that sits on both lines to hit both goals.
How would a point sit on both lines? Well, it would be where the lines cross. Since these are straight lines, the lines cross only once, which makes sense because there’s only a single milk and bread combo that would get you to exactly five grams of carbs and seven grams of protein.
Now we plot the lines together, see where they intersect, and that’s our answer:
Bam! We just found the solution using pictures.
So that’s a quick intro to Gaussian elimination. But you don’t need linear algebra to do Gaussian elimination. This is a technique that has been around for 2,000 years. It was discovered in Asia, it was rediscovered in Europe, I think in the 1600s or something, and no one was really talking about “linear algebra”. This trick is just very useful.
That’s the first big idea you learned. You can stop there if you want. You can practice doing this sort of elimination. It’s a very common and useful thing.
The column picture
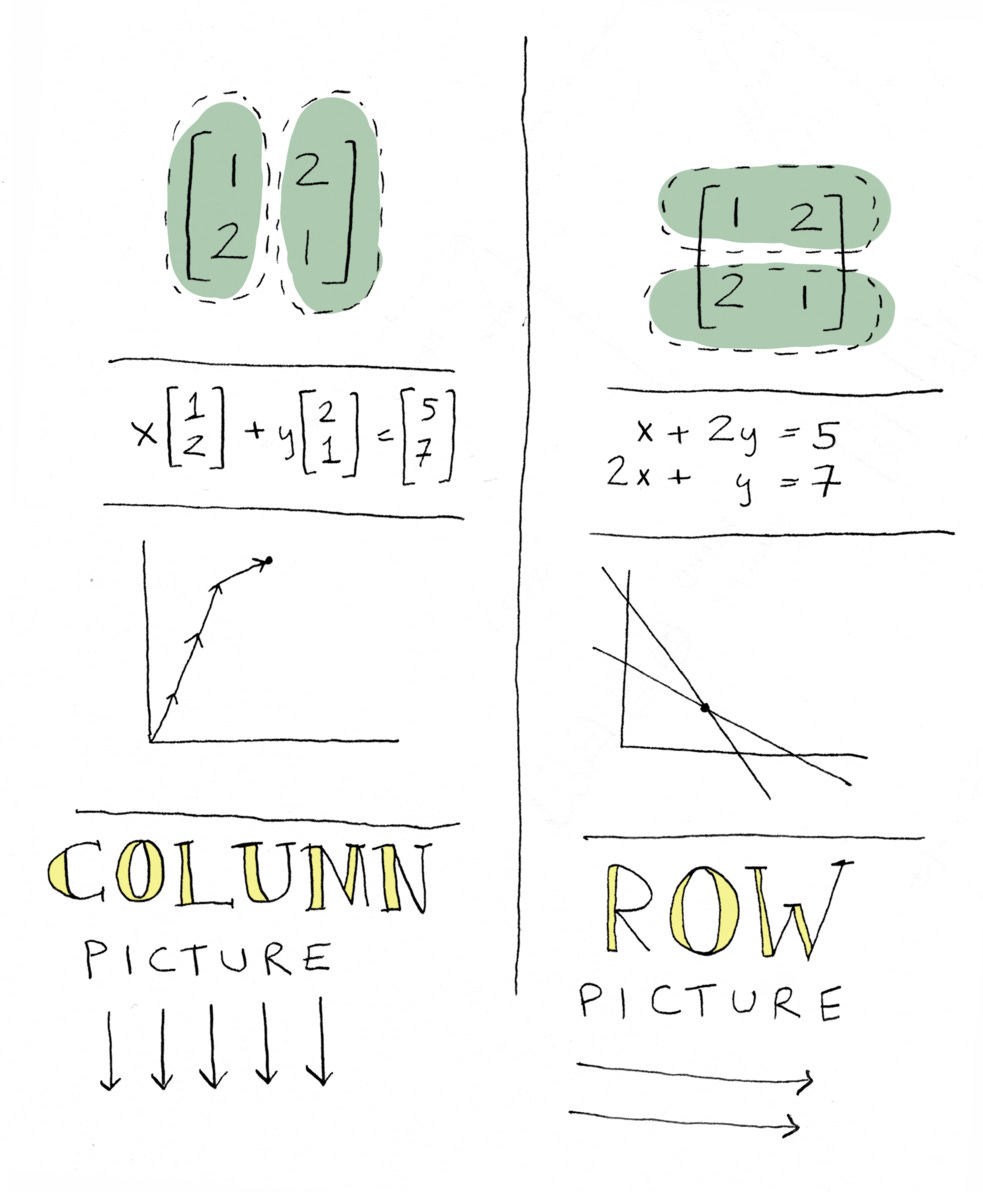
What we just saw is called the “row picture”. Now I want to show you the column picture. I’m going to introduce a new idea, which is: instead of writing this series of equations, what if we write just one equation? Remember how we had one equation for the nickels and pennies question?
What if we write one like that for food? Not a system of equations, just a single equation? What do you think that would look like? Something like this:
It’s an equation where the coefficients aren’t numbers, they’re an “array” of numbers. The big idea here is: what if we have a linear equation, but instead of numbers, we have arrays of numbers? What if we treat [1 2], the way we treat a number?
Can that actually work? If so, it is pretty revolutionary. Our whole lives we have been looking at just numbers, and now we’re saying, what if we look at arrays of numbers instead?
Let’s see how it could work in our food example. What if the coefficients are an array of numbers? Well, this way of thinking is actually kind of intuitive. You might find it even more intuitive than the system of equations version.
Each of these coefficients are called vectors. If you’re coming from computer science, you can kind of think of a vector as an array of numbers (i.e. the order matters).
Lets see how we can use vectors to find a solution to the bread and milk question.
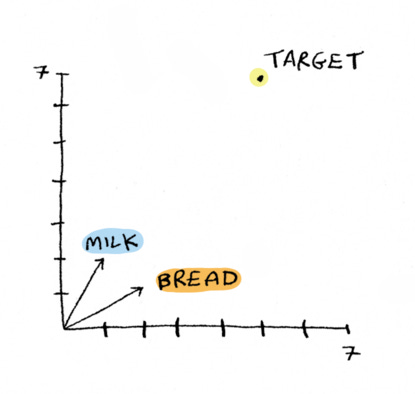
Step one: graph the vectors.
Yeah, we can graph vectors. We can graph them either as a point, like I’ve done for the target vector here, or as an arrow, which is what I’ve done with the vector for bread and the vector for milk:
Use the two numbers in the vector as the x and y coordinates.
That is another big idea here: We always think of a set of coordinates giving a point, but you can think of vectors as an arrow instead of just a point.
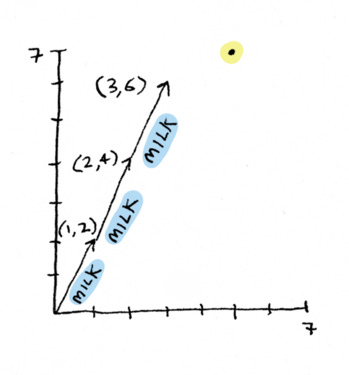
Now what we’re asking is how much milk and how much bread do we need, to get to that point?
This is a pretty simple question. It’s simple enough that we can actually see it. Let me add some milks:
And let me add a bread. Bingo bango, we’re at the point:
Yeah, we literally add them on, visually. I personally find this more intuitive. I think the system of equations picture can confuse me sometimes, because the initial question was, “how much bread and how much milk should I eat?” The vector way, you see it in terms of breads and milks. The row way, you see it as one of the lines is the carbs, the other line is the protein, and the x and y axes are the amount of bread, which results in the same thing, but it’s a little more roundabout, a little more abstract. This one is very direct.
The algebra way
We just saw that we can graph vectors too. Graphing it works differently from graphing the rows, but there is a graph we can make, and it works, which is pretty cool. What about the algebra way?
Here is the equation again:
Since we already know the answer, I’ll just plug that in:
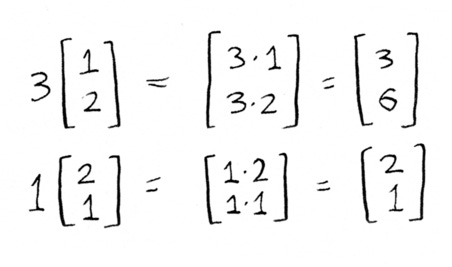
Now, the question is how does the left side equal the right side? The first question is how do you define this multiplication? Well, in linear algebra, it’s defined as, if you multiply a scalar by a vector, you just multiply it by each number in that vector:
Now you are left with two vectors. How do you add two vectors? Well, in the linear algebra you just add the individual elements of each vector:
And you end up with the answer.
Congratulations, you’ve just had your first taste of linear algebra. It’s a pretty big step, right? Instead of numbers, we’re working with arrays of numbers. In future chapters, we will see why this is so powerful.
That’s the first big concept of linear algebra: row picture vs column picture.
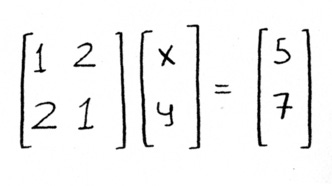
Finally, I’ll just leave you with this last teaser, which is: how would you write these two equations in matrix notation? Like this:
This is the exact same thing as before. You can write it as scalars times columns, as we had done before:
or you can write it as a matrix times a vector, as above. Either one works.
Matrices are a big part of linear algebra. But before we talk about matrices, we will talk about the dot product, which is coming up next.
More chapters coming soon! Subscribe to get an email when they come out.
Additional reading
Check out Gilbert Strang’s lectures on linear algebra on YouTube.
Summary
P.S. Want more art? Check out my Instagram.









![x * [[1] [2]] + y * [[2] [1]] = [[5] [7]] x * [[1] [2]] + y * [[2] [1]] = [[5] [7]]](https://substackcdn.com/image/fetch/$s_!uQbi!,w_1456,c_limit,f_auto,q_auto:good,fl_progressive:steep/https%3A%2F%2Fsubstack-post-media.s3.amazonaws.com%2Fpublic%2Fimages%2F1c3a203f-b553-4f58-b07f-0136742bf863_398x172.png)

![3 * [[1] [2]] + 1 * [[2] [1]] = [[5] [7]] 3 * [[1] [2]] + 1 * [[2] [1]] = [[5] [7]]](https://substackcdn.com/image/fetch/$s_!iADK!,w_1456,c_limit,f_auto,q_auto:good,fl_progressive:steep/https%3A%2F%2Fsubstack-post-media.s3.amazonaws.com%2Fpublic%2Fimages%2Fc16591c4-b38a-4997-92ad-2ca3605e65d7_344x149.png)
![[[3] [6]] + [[2] [1]] = [[5] [7]] [[3] [6]] + [[2] [1]] = [[5] [7]]](https://substackcdn.com/image/fetch/$s_!ayzR!,w_1456,c_limit,f_auto,q_auto:good,fl_progressive:steep/https%3A%2F%2Fsubstack-post-media.s3.amazonaws.com%2Fpublic%2Fimages%2F6cdc4eaf-8a67-4128-8189-3bbda4f3ad3d_291x491.png)
